by Robyn Dixon, Senior Viticulturist
Technical Review No. 259 August 2022
Inaccurate wine-grape yield estimates have an impact on the entire supply chain, particularly harvest planning and winery logistics. The task of yield estimation is made more difficult by large variations in yield from season to season. This article outlines some key considerations for improving the accuracy of yield estimates and reducing the time the process takes.
Key components of grapevine yield
Block yield potential is the sum of the yield of the individual vines within a block, which is influenced by:
- the number, type and fruitfulness of buds retained at pruning
- the number of shoots that develop from each bud (% bud burst)
- the number of bunches on these shoots
- the number of berries on the bunches
- the weight of the berries.
Contribution of each yield component to yield variability between seasons
The main sources of variation in yield between seasons are:
- variation in bunch number per vine (responsible for around 60% of variation)
- variation in berry number per bunch (responsible for around 30% of variation
- variation in berry weight (responsible for around 10% of variation).
The number of productive vines within a block should remain relatively stable from year to year. However, as vine age increases, vines can die, or vine productivity can start to decline. An accurate yield estimate requires an accurate vine count that accounts for dead, missing and unproductive vines. If target yield and quality, and grapevine management remain stable (e.g. pruning method, training system, irrigation program), bud numbers at pruning will remain relatively stable between seasons. The percentage bud burst can vary between seasons depending on the weather conditions over winter and leading up to bud burst.
When to collect yield data and what error to expect
Block yield can be estimated at any time of the year; however, as the season progresses, estimates tend to become more accurate as you get closer to harvest. There are key times during grapevine phenology when the potential of the various yield components is set. These are post-pruning, E-L 12 (5 leaves separated; shoots about 10 cm long; inflorescence clear), E-L 31 (berries pea-size/7 mm diameter) and at harvest. Relatively accurate estimates can be obtained at these key times, but they require accurate productive vine counts, accurate long-term average yield data, and unbiased and representative sampling (see Dunn 2010). By following correct procedures, growers can expect +/- 20% error with estimates from spring bunch counts (E-L 12), +/- 10-15% error with estimates based on berry counts after fruit set (E-L 31) and +/- 5% error with estimates based on harvesting segments (Dunn 2010).
Representative sampling
Other than ensuring that data is collected at the right time, another big factor that affects the accuracy of yield estimates is the sampling method. The number of sample vines required to give a representative sample may vary depending on the size and variability of the block. Dunn (2010) describes a method for determining the appropriate sample size required based on a balance between the time required to collect the samples and the tolerance for doubt. The lower the tolerance for doubt, the larger the sample size. An online Grape Forecasting tool was developed by the Victorian Department of Primary Industry, the Grape and Wine Research Development Corporation and agCOMMANDER to help growers manage their yield data and determine the appropriate sample size for each block. The tool is available from https://www.agcommander.com/grapeforecaster for an annual fee.
What data to collect
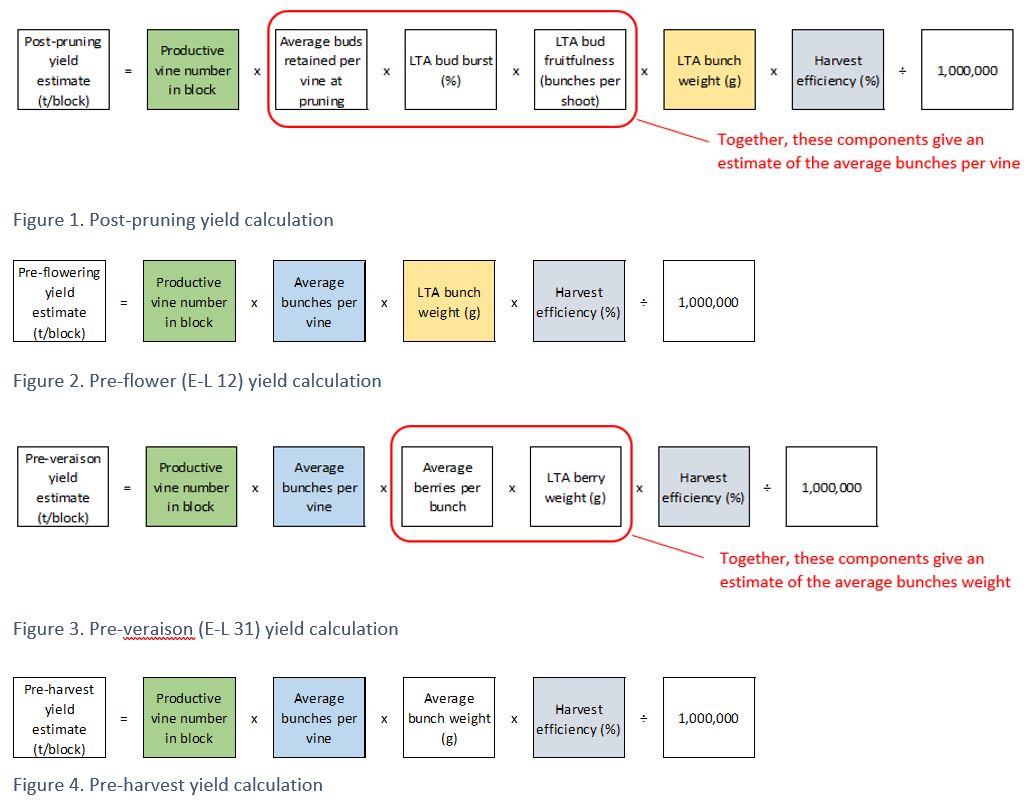
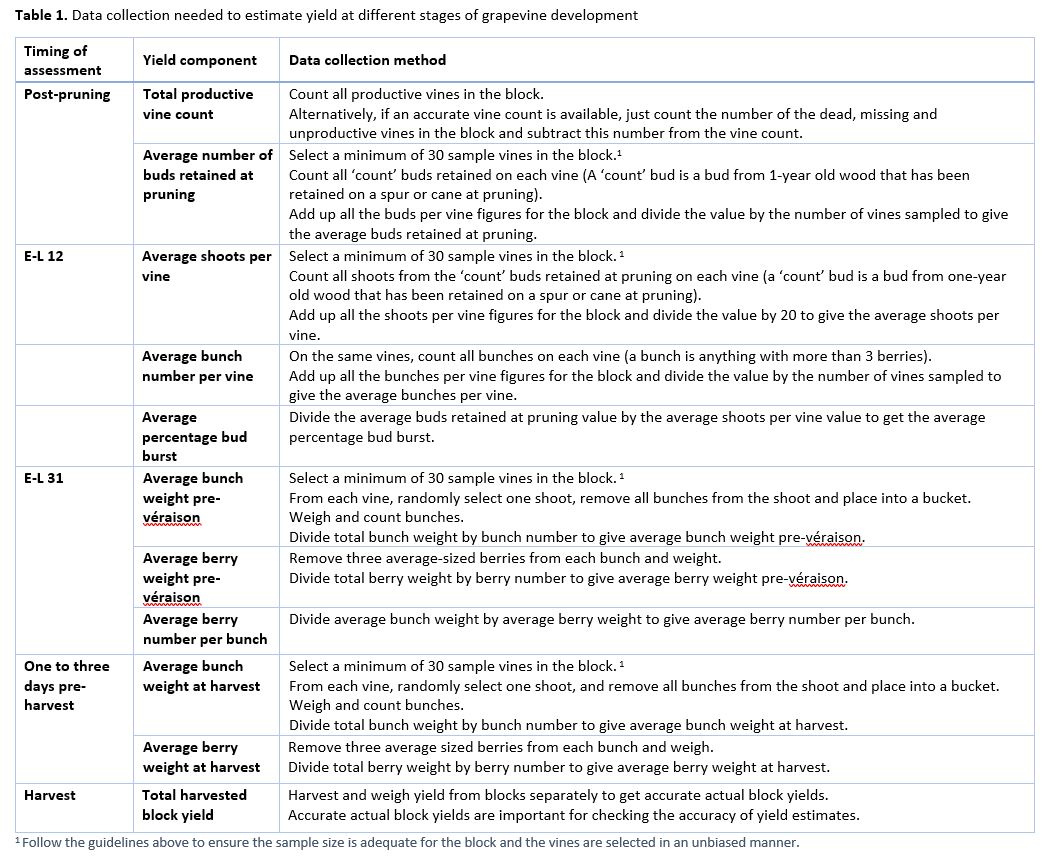
The key times for collecting yield data are post-pruning, pre-flower (E-L 12), pre-veraison (E-L 31) and at harvest. Table 1 summarises the data needed for yield estimation and Figures 1, 2, 3 and 4 show which yield components are used to estimate yield at these times and the calculations required.
As the season progresses the potential of various yield components is set. Before the potential of a particular yield component is set, long-term average data can be used to estimate the potential of a yield component. For example, after pruning the vine number per block and average bud number per vine is set while percentage budburst and bunch weight is still unknown. Growers that have conducted bud dissections may have an idea of the fruitfulness of the buds, but for most growers, this component is also unknown.
With each year that growers collect block specific yield data, the long-term average data calculated from the data becomes more meaningful. However, if the conditions during the season are very different from the average, long-term average yield data is less useful. To overcome this, some growers use yield data from analogue years in which the weather patterns were similar to the coming season to calculate yield.


AgTech solutions available to improve the accuracy of yield estimates
A plethora of AgTech solutions have entered the market, with many claiming to be able to predict yield with greater than 90% accuracy. One simple AgTech solution that growers can use to estimate vine number per block is a GPS measurement of the length of every row in a block and dividing this value by the known vine spacing. This method provides an estimate of the vine number, but does not account for any missing, dead or unproductive vines.
Satellite or aerial normalised difference vegetation index (NDVI) imagery can be used to give growers an understanding of the variability within their vineyard. Growers can use this information to identify representative sample sites within a block to ensure the correct proportion of high-, medium-, and low-vigour vines are sampled, and to improve the accuracy of yield estimates. The best time to collect NDVI imagery to identify variability in vine vigour is around véraison. In low vigour or vertically trained canopies, the mid row should be removed to ensure the maps produced are showing changes in the vines not the midrow.
Australian researchers have shown that video footage of vines can be used to calculate the length (m) of productive cordon within a block (Dunn and Whitty 2017 and Edwards 2020). This technology is now available for use in vineyards through a commercial supplier (Bitwise). The video footage is collected from a camera mounted on a vineyard vehicle when shoots are around 10 cm in length. The footage is then processed using AI technology to identify and count gaps in the canopy. The information is provided to growers in a report and an interactive map. It is essential that appropriate ground truthing is conducted on each block to ensure accurate footage processing using the AI technology. This technology is also being trialled to identify and count bunches in vines with good fruit exposure. They key to getting an accurate bunch count is collecting the footage after the inflorescences are clearly visible but before the canopy gets too dense.
Researchers in Australia and New Zealand have also been modelling block-level yields using historical vineyard data and weather data with some success (Van Sluyter 2020). The accuracy of these models relies on accurate historical vineyard data. Other researchers have been using Near Infrared Technology (NIR) to measure the fruitfulness of grapevine buds non-destructively in the field to assist growers with pruning decisions (Edwards 2020). The information may also help to improve early season yield estimates.
References and further reading
Dunn, G. 2010. Yield Forecasting. GWRDC fact sheet. Available from: https://www.mvwi.com.au/fact-sheet-categories/others/
Dunn, G., Whitty, M. 2017. Wine Australia Final report. Improved yield estimation for the Australian wine industry.
Edwards, E. Wine Australia Final Report. 2020. New non-destructive technologies for simultaneous yield, crop condition and quality estimation.
Iland, P., Dry, D., Proffitt, T., Tyerman, S. 2011. The Grapevine: from the science to the practice of growing vines for wine. Adelaide, SA: Patrick Iland Wine Promotions.
Jones, J. Wine Australia Final report. Taking grapevine yield forecasting into the digital age.
Keller, M. 2010. The science of grapevines: anatomy and physiology. USA: Academic Press: 377 p
Komm, B., Moyer, M. 2015. Washington State University Extension bulletin: Vineyard yield estimation.
Sams, B., Bramley, R., Sanchez, L., Dokoozlian, N., Ford, C., Pagay, V. 2022. Remote sensing, yield, physical characteristics, and fruit composition variability in Cabernet Sauvignon vineyards. Am. J. Enol. Vitic. 73: 93-105.
Disclaimer
This article should not be interpreted as an endorsement of any products mentioned.

