Technical Review No. 267, February 2024
Kieran Hirlam, Project Team Manager – Affinity Labs, kieran.hirlam@affinitylabs.com.au
Denny Hsieh, Project Engineer
Dr Eric Wilkes, General Manager – Affinity Labs
Introduction
The development of spectroscopic techniques for wine analysis has been transformative, enabling rapid testing rather than time-consuming and expensive reference measures. Techniques such as ultraviolet-visible (UV-Vis) absorption, Fourier-transform infrared (FTIR), nuclear magnetic resonance (NMR), near infrared (NIR) and Raman spectroscopy have been used to analyse wine components such as sugars, acids, alcohols and tannins, and even to assess aspects such as grape variety, ageing time and wine oxidation (Basalekou et al. 2017, Martelo-Vidal and Vazquez 2014, Moreira and Santos 2005; Smith and Scrimgeour 2010, Philippidis et al. 2020). The use of spectroscopy in the wine industry can streamline production, allowing winemakers to make adjustments in real time, improving efficiency and quality. Further applications include supporting blending decisions and barrel ageing management.
BevScan –non-destructive analysis in-bottle
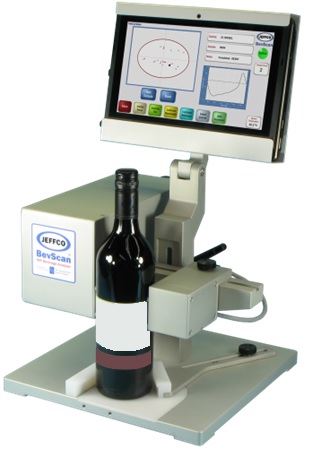
In the early 2010s, the advantages of spectroscopy for wine analysis were taken one step further, through the development of the BevScan instrument by the AWRI and partner Jeffress Engineering (Figure 1). The BevScan is a visible-near infrared spectroscopy instrument that allows wine to be analysed non-destructively through the glass bottle – that is, without needing to open the bottle and sub-sample the contents. This breakthrough provides a number of benefits including the ability to screen wine stocks that are exhibiting variability prior to sale or to follow changes in bottled wine over time.
By capturing spectral data across a wide wavelength range, BevScan discerns subtle variations in wine profiles and processes the data with the aid of chemometric software. BevScan operates in different modes, depending on testing requirements, including the option to set up a spectral profile based on multiple bottles, and then compare other bottles against it. More details about BevScan’s different modes are provided in the AWRI fact sheet: Using BevScan for wine analysis and classification.

Figure 1. BevScan instrument, showing the ability to analyse wine through the bottle
Testing BevScan’s ability to assess variable oxidation
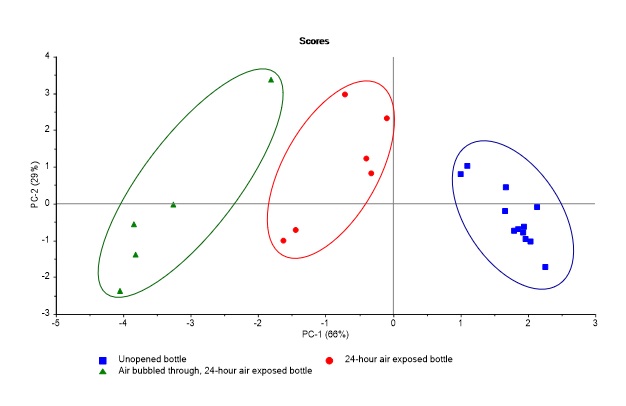
Recently an evaluation was carried out to explore BevScan’s ability to separate and classify bottles of the same wine that had been influenced by different environmental conditions. Twenty-three bottles of 2021 Adelaide Hills Cabernet Sauvignon were purchased for the experiment. Twelve bottles were left sealed and intact (labelled ‘Unopened bottle’). Six bottles were left for 24 hours with screwcaps removed, exposing the wine to air (labelled ‘24-hour air exposed bottle’). For the final five bottles, the contents of each was decanted into a vessel, had air bubbled through it for a period of five minutes and was then returned to the original packaging, with the screwcap not reapplied (labelled ‘Air bubbled through, 24-hour air exposed bottle’). All samples were then screened using BevScan 24 hours after the treatment, with the raw data processed through an external multivariate analytics program (Unscrambler 11). Two bottles from each subset were analysed by Affinity Labs for analytes typically used to assess oxidation including free and total SO2 and colour attributes.
A principal component analysis (PCA) was undertaken on the raw spectral outputs from the BevScan (Figure 1). The PCA explained 95% of the variability among the samples, with principal component 1 (PC-1) detailing 66% of the variation. Based on the data output as screened by the BevScan through the bottle, PC-1 showed separation among the three subsets of samples after 24 hours, with clear clustering relating to the degree to which the bottles of wine had been exposed to oxygen. There was also a decrease in free SO2 observed in the samples exposed to oxygen seen in results from the destructive testing (data not shown). Of the colour attributes, total pigment and % pigmented tannin showed differences among the treatments, correlating with the PCA spread.

Figure 2. Principal Component Analysis showing the separation of samples according to their exposure to oxygen. Raw spectral data were generated by BevScan and transformed through Unscrambler.
Previous industry applications using the BevScan
AWRI closure study
A batch of Semillon wine from the 2002 vintage remained following an AWRI closure study, and in order to present samples to industry, there was a need to distinguish between oxidised and unoxidised bottles of the small batch remaining. The method involved initially scanning 24 bottles using the BevScan instrument’s calibration function to create a baseline profile. Following this, the bottles were opened for sensory evaluation, specifically targeting any signs of oxidation. The results, particularly the oxidation scores, were used to refine the calibration profile. The remaining bottles were non-destructively screened to identify any potentially oxidised ones. The spectral outcomes were cross-referenced with chemical analyses for validation.
The preliminary profile was created by scanning 24 bottles at four positions, resulting in a dataset of 96 points. Two bottles showing potential oxidation were excluded from the profile to refine the benchmark. The refined calibration was then used to classify an additional 24 bottles, with those falling within the profile labelled as ‘good’ and those outside as ‘suspect’. Validation involved sensory and chemical evaluations of the ‘suspect’ bottles alongside a ‘good’ sample, confirming the accuracy of the classifications.
BevScan’s calibration function proved effective in sorting white wine affected by variable oxidation, enabling wines in good condition to be presented for industry engagement and training purposes.
Angove Family Winemakers screening for oxidation
Angove Family Winemakers collaborated with the AWRI to evaluate a batch of red wine for oxidation using BevScan technology. This enabled the identification of bottles with desirable development characteristics, streamlining international stock movement.
Initially, spectral scanning of 72 bottles revealed differing oxidation levels via Principal Component Analysis (PCA). Chemical analysis confirmed oxidation in some samples, leading to refinement of the calibration profile. Removal of oxidised samples resulted in a calibration profile that was then used for the non-destructive screening of 716 cases for wine classification.
Chemical analysis of rejected samples validated their unsuitability for sale, primarily due to wine oxidation. Just one of the rejected samples displayed acceptable attributes, deviating from expected oxidative characteristics. Overall this process enabled Angove Family Winemakers to identify oxidation variation, and ensure delivery of top-quality wines to customers, maximising inventory value.
BevScan – still a useful tool
While BevScan has not been used as frequently in recent years as it was immediately after its launch, several recent applications have found that it is still an incredibly useful tool, with its non-destructive testing offering a unique option for situations where variability among a batch of wine needs to be assessed. Producers interested in using BevScan to screen bottled wine are encouraged to contact Affinity Labs via customerservice@affinitylabs.com.au or 08 8313 0444.
Acknowledgements
AWRI communications are supported by Wine Australia, with levies from Australia’s grapegrowers and winemakers matching funding from the Australian Government. The AWRI is a member of the Wine Innovation Cluster in Adelaide, SA.
References and further reading
Basalekou, M., Pappas, C., Tarantilis, P., Kotseridis, Y., Kallithraka, S. 2017. Wine authentication with Fourier Transform Infrared Spectroscopy: A feasibility study on variety, type of barrel wood and ageing time classification. Int. J. Food Sci. Tech. 52(6): 1307-1313.
Martelo-Vidal, M. J., Vazquez, M. 2014. Evaluation of ultraviolet, visible, and near infrared spectroscopy for the analysis of wine compounds. Czech J. Food Sci. 32(1): 37-47.
Moreira, J. L., Santos, L. 2005. Analysis of organic acids in wines by Fourier-transform infrared spectroscopy. Analyt. Bioanalyt. Chem. 382: 421-425.
Smith, P, Scrimgeour, N 2010. Case study: Using BevScan to screen bottles of a white wine affected by variable oxidation. Available from: AWRI website
Philippidis, A., Poulakis, E., Kontzedaki, R., Orfanakis, E., Symianaki, A., Zoumi, A., Velegrakis, M. 2020. Application of Ultraviolet-Visible Absorption Spectroscopy with Machine Learning Techniques for the Classification of Cretan Wines. Foods 10(1): 9.

This work is licensed under a Creative Commons Attribution-NonCommercial-NoDerivatives 4.0 International License.

