Technical Review No. 266, November 2023
Eric Wilkes – General Manager, Affinity Labs, eric.wilkes@affinitylabs.com.au
Introduction
Recent changes to European Union regulations for wine labelling mean that wines produced after 8 December 2023 (i.e. vintage 2024 wines in Australia) will require a value for dietary energy content on the label as well as an online ingredient list and nutritional panel accessed via a unique QR code. The energy value is readily calculated using the procedures outlined in Wilkes (2021a). Many laboratories are also now including it on certificates of analysis for wines destined for Europe. The ingredient listing is also relatively straight forward with a prescribed list of descriptors available in European regulation. More detail on these can be found at the Wine Australia website where there is a webinar on the requirements and other resources. A number of providers both in Australia and Europe are offering services to develop and provide QR codes and linked web sites for use on labels for producers who do not have the capability to do this in-house.
Some of the information required for the nutritional panel includes fats (total and saturated), carbohydrates, sugars, protein and salt. These are not typically measured in the Australian wine industry and the cost for getting a full nutritional panel analysis through a testing laboratory can be approximately $300 per sample. To address this, the AWRI through its commercial arm Affinity Labs has surveyed a range of results from its commercial testing database to determine if a group of typical values might be appropriate for use on European nutritional panels rather than having to test individual wines.
Fats and proteins
Over the last 12 months Affinity Labs has tested 66 wines for nutritional information using an ISO17025 accredited facility and recognised analytical techniques. The samples included:
- Red, white and rosé wines
- 20 wines with less than 11% v/v alcohol
- 9 wines with less than 4.6% v/v alcohol.
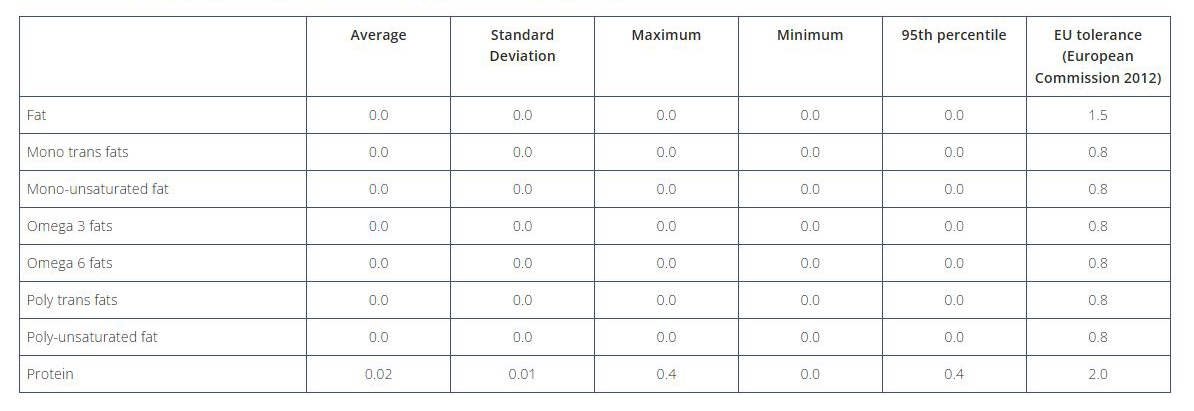
Results for fats and proteins are shown in Table 1.
Table 1. Results from analysis of fats and proteins in 66 Australian wines. All results are in g/100 mL

None of the wines tested showed any fat content under any of the categories tested. The European guidelines for fats state that levels <0.5 g/100 mL can be declared as 0 g/100 mL. For saturated fat a 0 g/100 mL declaration is allowed for levels < 0.1g/100 mL. This data therefore would support the generic labelling of typical Australian wines with 0 g/100 mL for both fat and saturated fat.
For proteins, as would be expected, small amounts were detected, ranging in concentration from 0 to 0.4 g/100 mL. Similarly to fats, the European guidelines allow amounts of protein below 0.5 g/100 mL to be labelled as 0 g/100 mL. It would therefore seem appropriate that a 0 g/100 mL value would be reasonable for a typical Australian wines.
It is important to note that these results, as stated, can be applied to typical Australian wines, namely unfortified red, white and rosé wines with sugar levels between 0 and 12 g/L of sugar. Based on a previous survey looking at typical energy values in Australian wines (Wilkes 2021) this would represent 99% of Australian red wines and 93% of Australian white wines. The data should not be extrapolated to other wine styles or wine products without careful consideration.
Salt
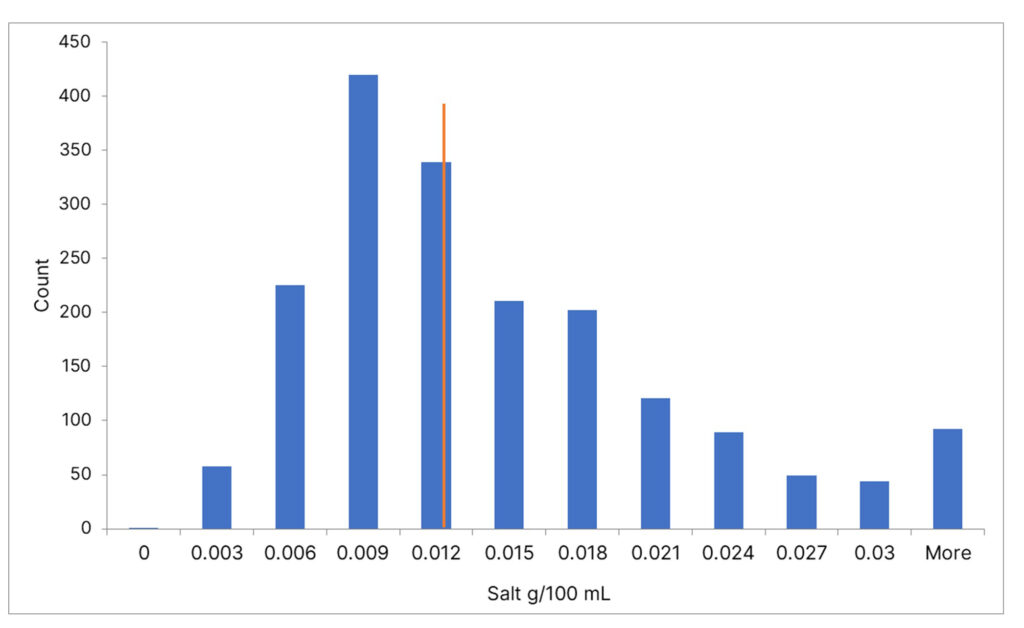
Salt in the form of sodium chloride is not directly measured in wines. Rather the general approach for regulatory matters in Europe is to measure the concentration of sodium in g/100mL in the wine and then express it as sodium chloride by multiplying it by 2.5. To gain an understanding of the typical levels of salt in Australian wines, the Affinity Labs database was reviewed for wines submitted for metals analysis between 2016 and 2019. This identified 1,851 sodium results for still red, white and rosé wines, which were then converted to salt values, consistent with European regulations, with the results for this data set presented in Table 2 and Figure 1.
Table 2. Calculated salt results for 1,851 Australian still red, white and rosé wines, based on their sodium content. All results are in g/100 mL.


Figure 1. Distribution of calculated salt results for 1,851 Australian red, white and rosé wines still wines based on their sodium content. The orange line represents the median value of 0.011 g/100mL. All results are in g/100 mL. Number on x axis represents upper bound of each range of concentrations.
The European guidelines (European Commission 2012) state that salt concentrations <0.0125 g/100 mL can be declared as 0 g/100 mL. The average value for Australian wines in this dataset, however, falls above this at 0.013 g/100 mL, making it difficult to propose a 0 g/100 mL declaration if almost half the results were falling above the threshold. It could be argued that the tolerance for measurement prescribed in the same reference of 0.375 g/100 mL means that a 0 g/100 mL result could be declared and easily fall within the tolerance. The author contends, however, that this is an interpretation that could be open for debate and would imply some risk of being questioned if the wine was tested in a destination market. Instead, a safer approach would be to declare a result of 0.03 g/100 mL of salt (based on the 95th percentile for the dataset) and given the tolerances allowed this would easily cover all wines in the survey. This would still represent a very low salt content declaration from a consumer intake perspective.
Sugars and carbohydrates
All wine exported to the European Union are required to provide a certificate of analysis which includes a value for sugar content as part of the export licence process. As such this value is readily available to producers when developing their label. Carbohydrates in wine are generally considered for the purpose of nutritional labelling in Europe to include the sugar and glycerol present in the wine. While glycerol content of wine is not regularly measured in Australian wine production, a previous survey (Wilkes 2021b) showed typical values of 0.5 g/100 mL for white wines and 1.0 g/100 mL for reds. It is reasonable to add the appropriate typical glycerol figure to the measured sugar value to produce a value for carbohydrate that will fall within the tolerance (2.0 g/100 mL) as prescribed in the guidance document (European Commission 2012).
Conclusion
Based on the survey data presented above and the published tolerances and rounding guidelines for data in European nutritional panels, it is easily defensible to label typical Australian still wines with 0 g/100mL for fat, saturated fat and protein. Furthermore, using a value of 0.03 g/100 mL for salt would present little risk of dispute and easily fall within the published tolerances. It is arguable that a 0 g/100 mL claim for salt would also fall within the prescribed tolerances, but this may be open for dispute given the published threshold for a 0 g/100 mL claim. All exported wine has a known concentration for sugar and this can be used for sugar value in the nutritional panel, with the carbohydrate value calculated by simply adding the typical value for glycerol (0.5 and 1.0 g/100 mL for white and red wines, respectively) to the sugar value.
References
Wine Australia. EU Nutrition Labelling webinar. Available from: https://www.wineaustralia.com/whats-happening/events/eu-nutrition-labelling-webinar
European Commission – Health and Consumers Director General Guidance Document for tolerances of nutrient values declared on a label. Available from: https://food.ec.europa.eu/system/files/2016-10/labelling_nutrition-vitamins_minerals-guidance_tolerances_1212_en.pdf
Wilkes, E. 2021a. Style-based energy content categories in Australian wine. AWRI Tech. Rev. 254: 6-9.
Wilkes, E. 2021b Impact of wine components on energy label calculations. AWRI Tech. Rev 253.
Acknowledgements
AWRI communications are supported by Wine Australia, with levies from Australia’s grapegrowers and winemakers and matching funding from the Australian Government. Affinity Labs is thanked for providing the data presented in this article.

This work is licensed under a Creative Commons Attribution-NonCommercial-NoDerivatives 4.0 International License.

